![]()
ABOUT
BUILDING CITY DASHBOARDS
This project addressed how to build more extensive and effective city dashboards. It tackled three sets of fundamental problems: data issues; visualisation/interaction issues; and analytics/modelling issues. It used the solutions to undertake applied research that significantly extend the Dublin Dashboard through the development and testing of a new suite of querying, modelling and prediction/simulation modules and novel forms of multimedia interaction, including virtual reality, the projection of data onto architectural models, and converting data into audio-textual forms. This testbed provided a template to develop, implement and test a Cork Dashboard and influence dashboard development globally.
READ MORE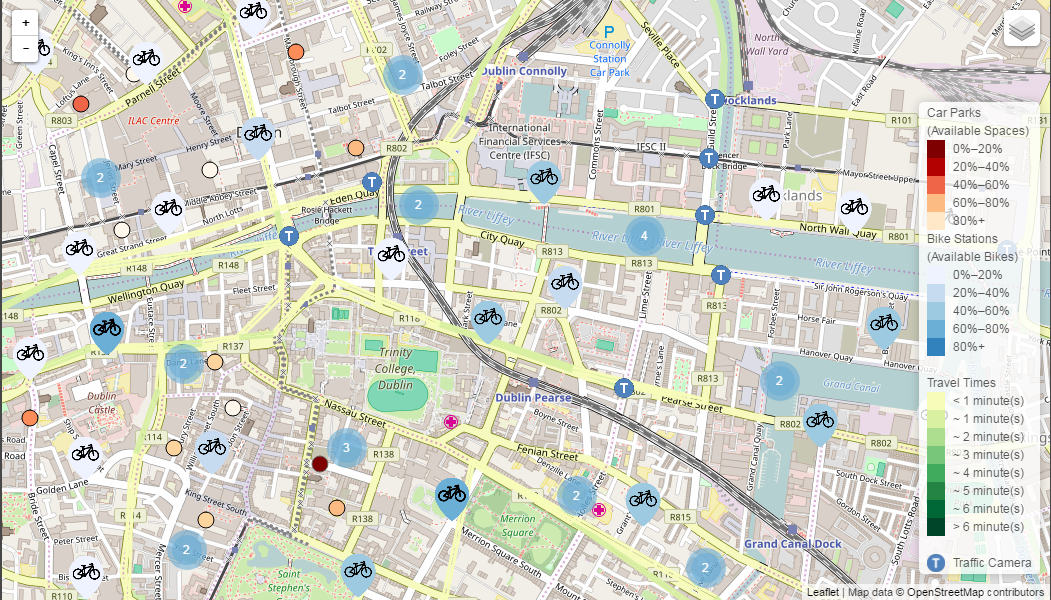
TEAM


EXHIBITION
See Exhibition
PROJECT OUTPUTS
See outputsDASHBOARDS
The Building City Dashboards project, funded by Science Foundation Ireland, ran from 2016-2020. The dashboards were live until January 2022 when they were decommissioned. The Dublin and Cork dashboard urls now link to the Building City Dashboards exhibition page where you can find video presentations, and details of associated code repositories and documentation.
THE DUBLIN DASHBOARD
The Dublin Dashboard provides citizens, public sector workers and companies with real-time information, time-series indicator data, and interactive maps about all aspects of the city. It enables users to gain detailed, up-to-date intelligence about the city that aids everyday decision making and fosters evidence-informed analysis.

THE CORK DASHBOARD
The Cork Dashboard was launched by our team in December 2017 and builds on lessons learned from Dublin.

USEFUL LINKS
To find out more about institutes and research groups carrying out similar or complimentary work click below.
THE BLOG
Mapping the lateness of Dublin buses
Dublin Bus does not release location information of its buses while in motion. However, they do periodically release information gathered from each stop a bus makes. Sometimes it can be found on Smart Dublin. The BCD team looked at one of the days in a sample of this data added to Smart Dublin to track where, how late, and at what time of day buses were late in Dublin. Using R mapping and data table
Clustering Dublin traffic time series
Unsupervised clustering processes bring order to unexplored data by creating groups, or clusters, of input data objects based on properties which are otherwise difficult to see with the naked eye. The similarities and differences between clusters and their object members reveal a structure that can be further investigated. Clustering may be the first step in an analytical process to understand a large collection of data with multiple dimensions which are difficult to view at once.
CONTACT US
Email Us
Address
Building City Dashboards
Iontas Building
Maynooth University
Maynooth
Co. Kildare
IRELAND
T: 00 353 (1) 708 6146
E: mussi [at] mu.ie


